How to use GlyCulator 3.0

To start a new analysis in GlyCulator 3.0 click on the "Create new" button in the menu on the left-hand side.
Every analysis comprises 5 subsequent steps, i.e:
- Starting new analysis (Create New section jump to video tutorial)
- Verifying uploaded files (Statistics section jump to video tutorial)
- Choosing desired files for the analysis and the date range for all of the files (Summary section jump to video tutorial)
- Setting analysis parameters (Parameters section jump to video tutorial)
- Viewing the results (Results section jump to video tutorial)
Create New
Video tutorial
Description
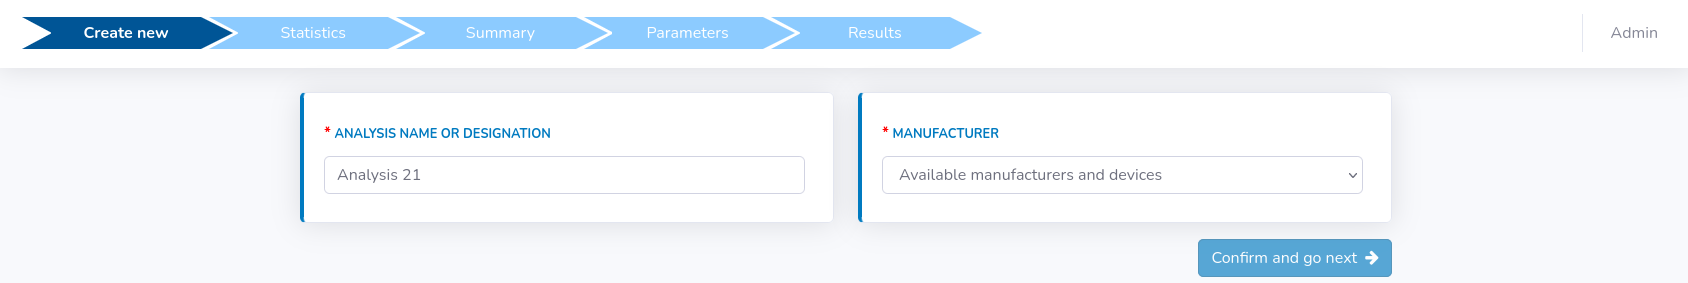
This section will call up the first panel, where some basic analysis information should be filled (see figure below).Notice a progress bar that appears at the top of the page. It facilitates the overall orientation and shows at which step of the analysis you are at the moment.
- Abbott (FreeStyle Libre as either .csv or .txt files)
- Dexcom (G4, G5, G6 as .csv files)
- Medtronic (Guardian and Guardian Link as .csv files)
- Senseonics (Eversense as .xlsx files)
- GlyQ (.csv files)
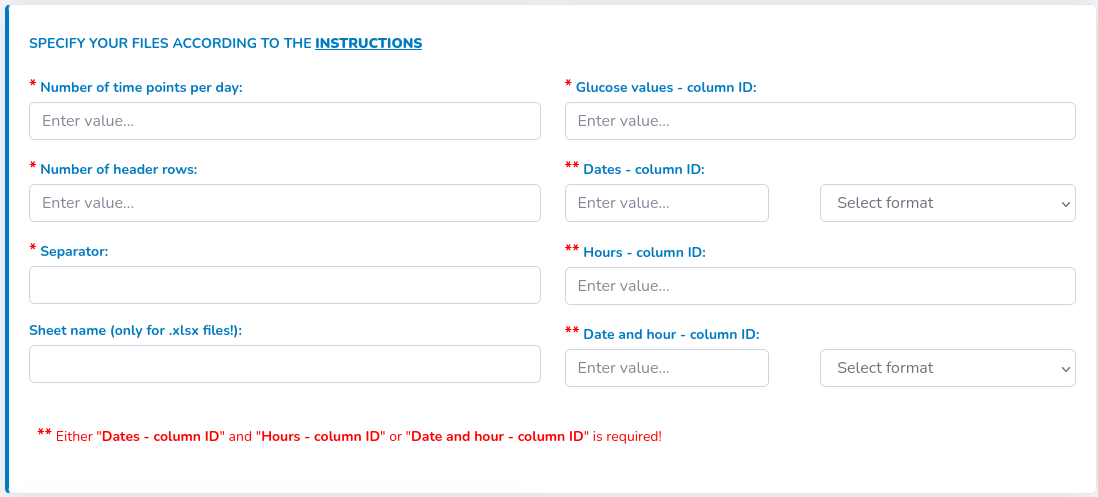
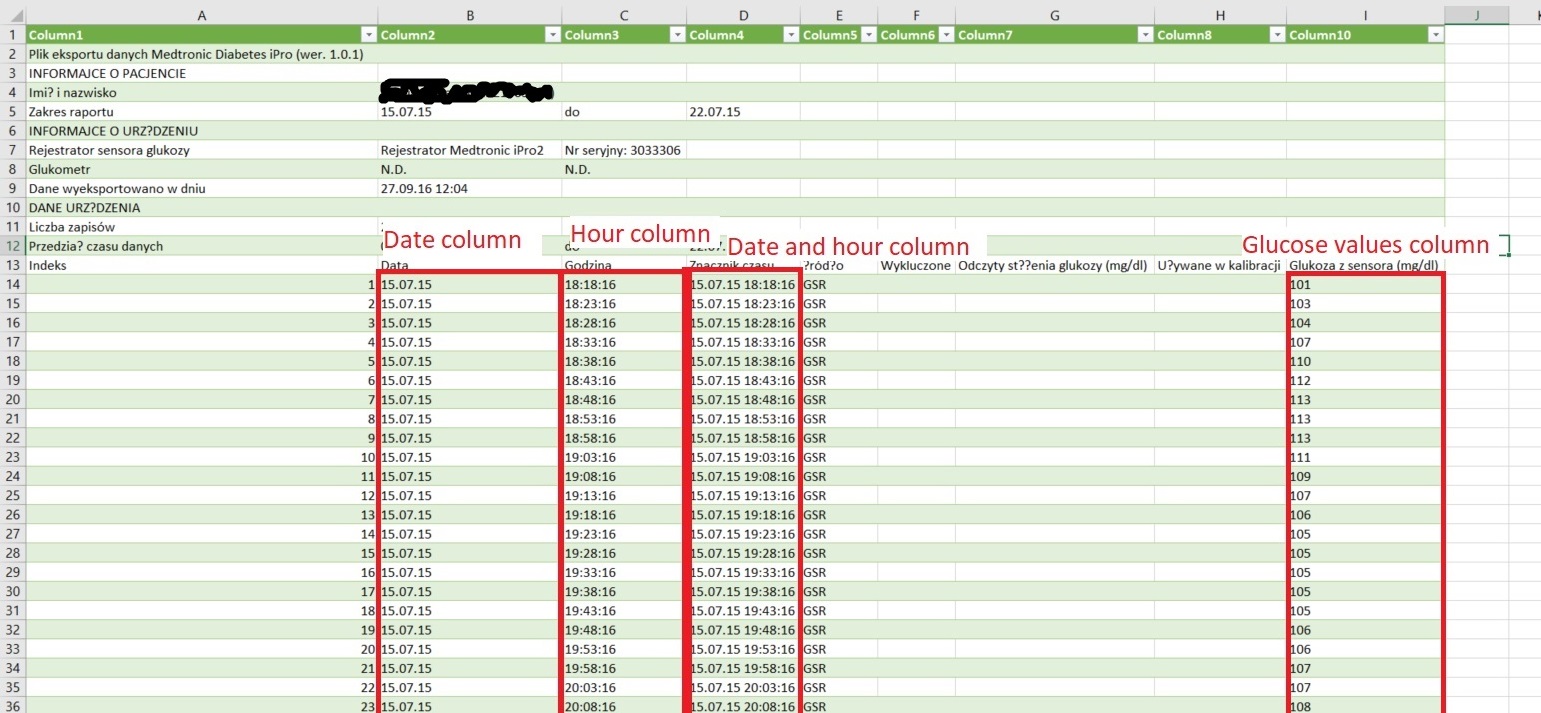
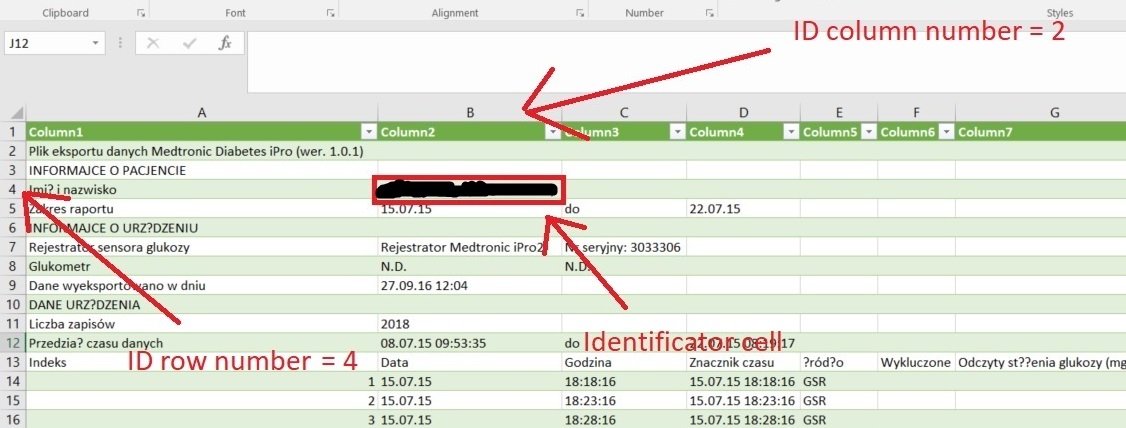
Please note that the numbering of columns and rows begins from 1. Column ID values can be provided as characters (e.g. "A", "AC").
- "Number of time points per day" - related to the expected interval between the sensor measurements. Please input 288 if the interval is 5 minutes, 96 if it is 15 minutes or other depending on the expected interval – this is used to compute the % of available daily measurements and to adjust the timestamp of sensor measurements for the interval-based glycemic variability indices
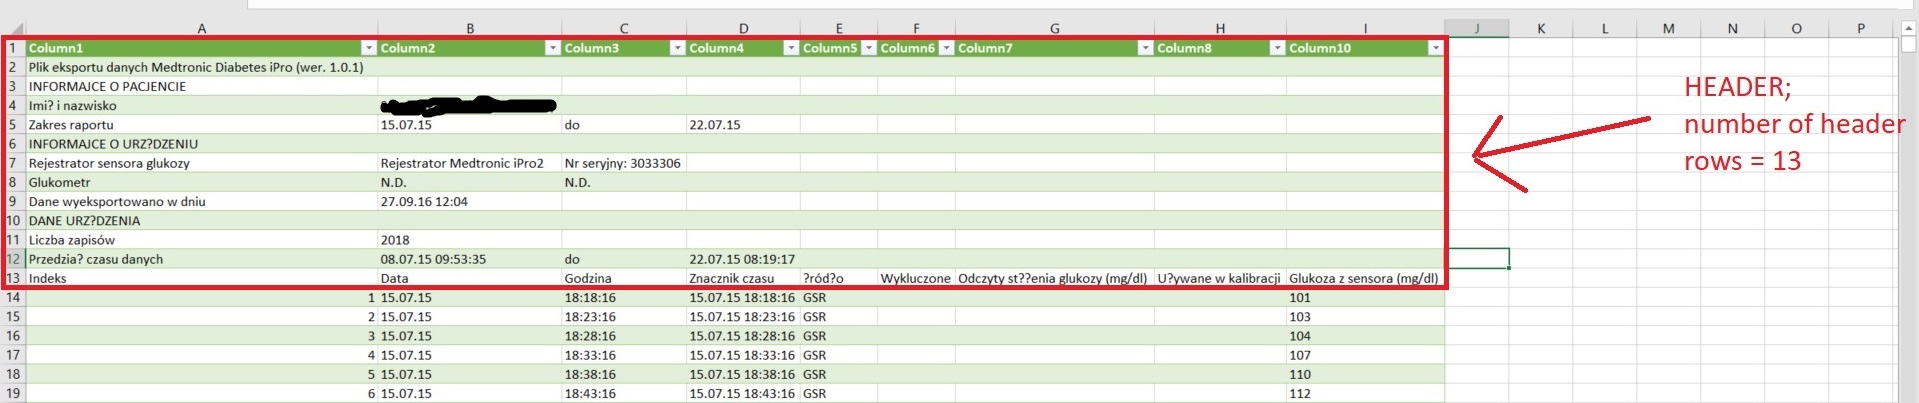
- "Number of header rows" in all files - this an optional argument. If your files do not contain headers, change it to 0
- "Separator" - please provide a character that fulfils the separator role in your files (if it is tab-separated files, indicate it with "\t")
- "Sheet name" – this option applies only to files, which are provided in .xslx format – since there might be multiple sheets in a single .xlsx file, you should specify which is the one to take data from. Default sheet name in Excel is “Sheet1”, but check whether you have not change it to some other name.
- "Glucose value – column ID" is required for proper input of glucose values
- "Dates – column ID" and "Hours – column ID" or "Date and hour – column ID". If your files contain no column with date and hour, please leave the field blank. If your files do not have two separate columns with dates and numbers, you can leave the appropriate fields empty or leave them as they are.
- Format of the date: please specify the order of day, month, year as well as hours, minutes if "Date and hour - column ID" specified (choose from the list visible next to either "Dates - column ID" or "Date and hour – column ID"). Please, do not mind the separator type, it does not have to be "/" as indicated in the list options.
Therefore, the data provided by the user in terms of device or data structure need to hold true for all the files provided.
Hence, if you chose e.g. "Abbot", you won't be able to choose from Dexcom, Medtronic etc.
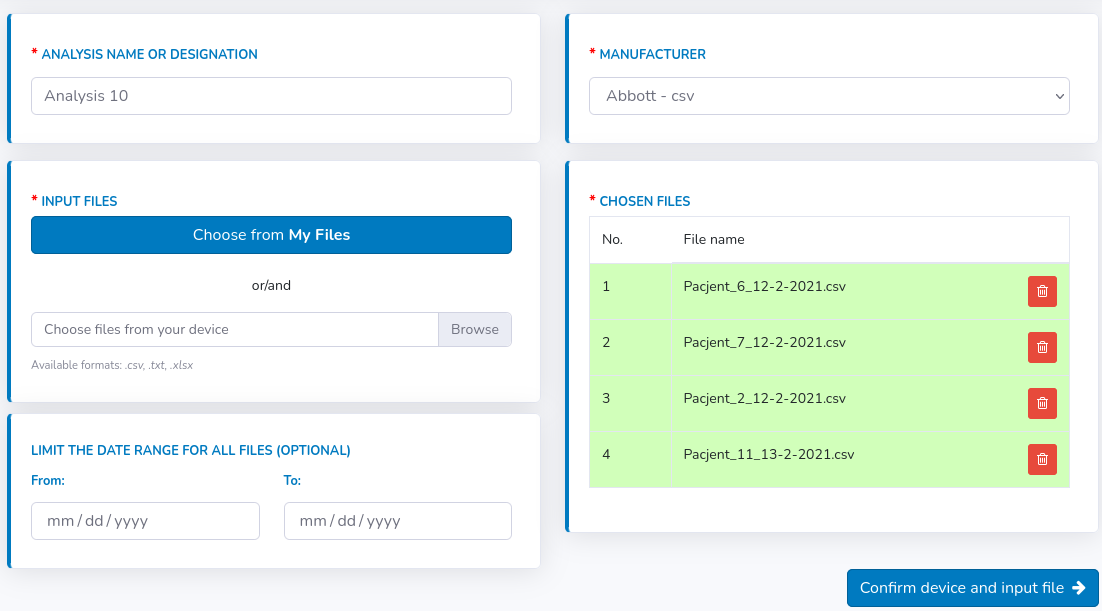
There is also an additional option underneath the "Browse" field. User may enter the desired date range for all files to be uploaded. Then, instead of displaying all content of files in the Statistics section, the data will be shown only for the chosen period. At the end, the view should look like this:
Statistics
Video tutorial
Description
In this section, basic statistics concerning each file will be displayed (see figure below).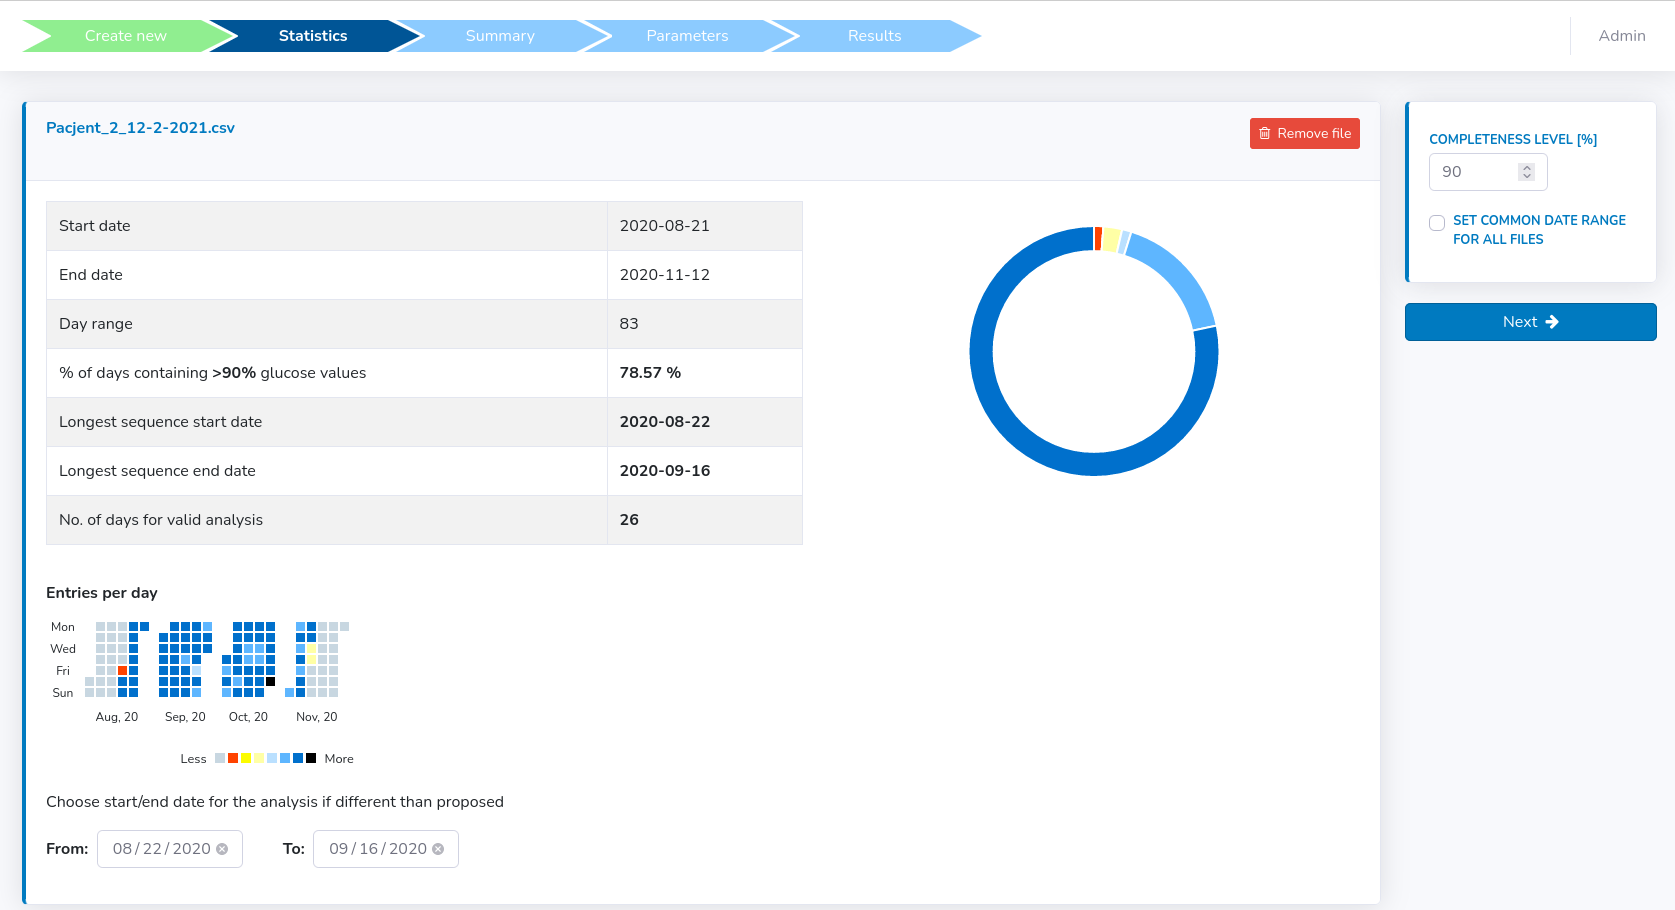
- "Start/End date" within the provided file with valid glucose records. If predefined at an earlier stage – the start/end will be limited to the predefined range (or shorter if valid data is not available at start and end dates)
- "% days containing N% glucose values" - how many days had more than given daily % of available measurements data (predefined at 90% of available valid measurements, not missing) - presented in details in "Entries per day" at the bottom and "Donut Chart" on the right
- "Longest sequence start/end date" – the start and end dates for the determined longest consecutive sequence of days with more than daily N% of valid records
One can specify start and end day for the analysis basing on the presented file details.
GlyCulator automatically sets default values as calculated for the longest sequence, however, they can be changed manually by the user.
GlyCulator automatically sets records for further analysis as the one calculated for the longest sequence. Still, you can change the dates manually for each individual file.
Alternatively, you can set common date range for all files by ticking such an option on the right.
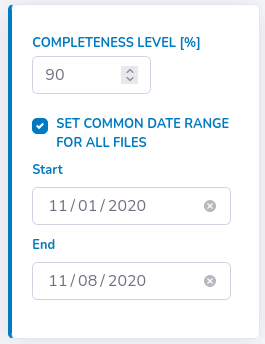
GlyCulator will ask you then whether you want to proceed or not - if yes, then all files not fulfilling the requirement will be removed from further analysis.
Moreover, GlyCulator can dynamically recalculate statistics for all files for different "Completeness level".
- e.g. if "80%" of valid records per day is satisfactory, then GlyCulator would find a new longest sequence for chosen completeness level.
If the CGM records entered for the calculations are incomplete, i.e. contain many missing values, the resulting GV parameters might not reliably reflect the patient`s clinical profile (e.g. might underestimate time spent in hypoglycemia). Therefore, it is advised that CGM records should cover at least 14 days with >70% of non-missing data to be eligible for analysis. In some cases, it might be possible to proceed with shorter CGM records with higher completeness or longer but more depleted – but current guidelines do not advise this, be warned.
If there is a file you eventually do not want to include in the analysis, it can be easily removed via the "Remove file" button.
If the data is correct, click the "Next" button.
Summary
Video tutorial
Description
The summary includes quality control representation of files picked for the analysis and their corresponding daily % of valid records.Here, one can see how many days were chosen for each file and set their common start and end days included for final analysis (see figure below).
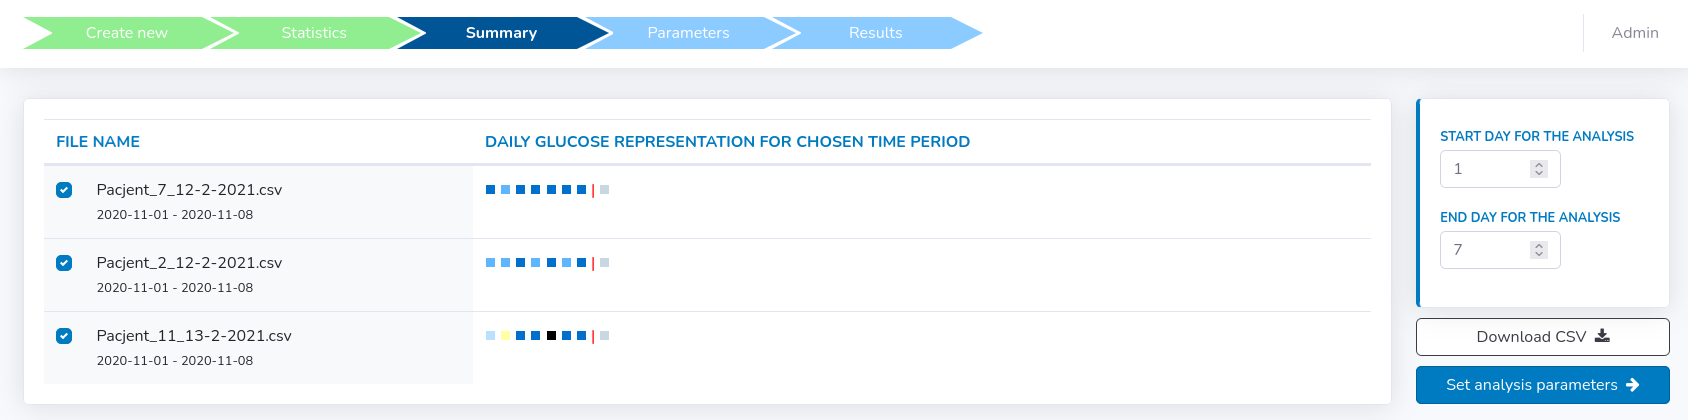
There is also a possibility to download a summary .csv file including all raw data taken into account for specified days selected for the final analysis.
If the data selection is correct, click the "Set analysis parameters" button.
Parameters
Video tutorial
Description
In this section, there are multiple things to be configured (see figure below).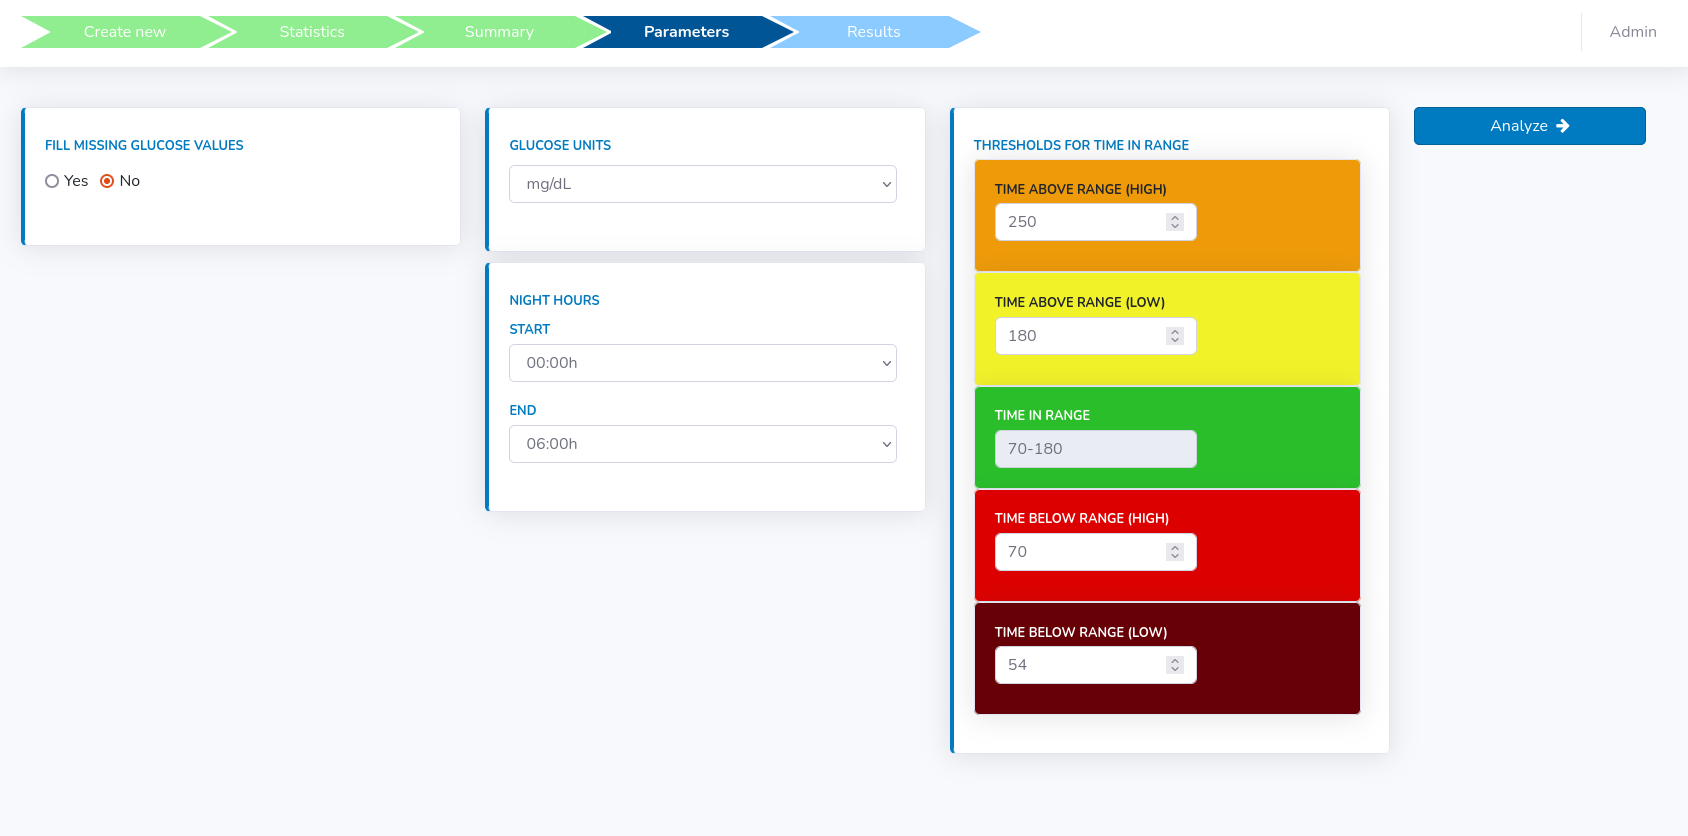
The presence of missing data not only impair the quality of calculated GV indices but might also make the calculation of some complex devices impossible. To counteract that, Glyculator offers an option to impute missing data in gaps of reasonable length.
In order to do that, select "Yes" in the "Fill missing glucose values" field and fill a new form that appears.
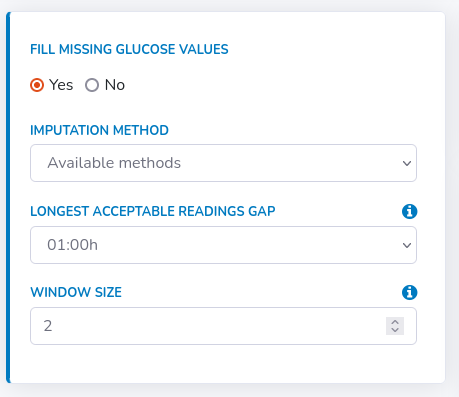
Secondly, specify the longest acceptable readings gap, meaning the longest period for which the missing values should be computed.
If the expected variability of glucose levels in the measurement period is high, this time should be decreased in order to avoid distortions.
Furthermore, one can also specify glucose units, which is set to mg/dL as default. For mmol/L "Thresholds for time in range" will be recalculated accordingly.
The user may also change default values for "Thresholds for time in range" if such need arises.
Then, if the data is correct, click the "Analyze" button.
Results
Video tutorial
Description
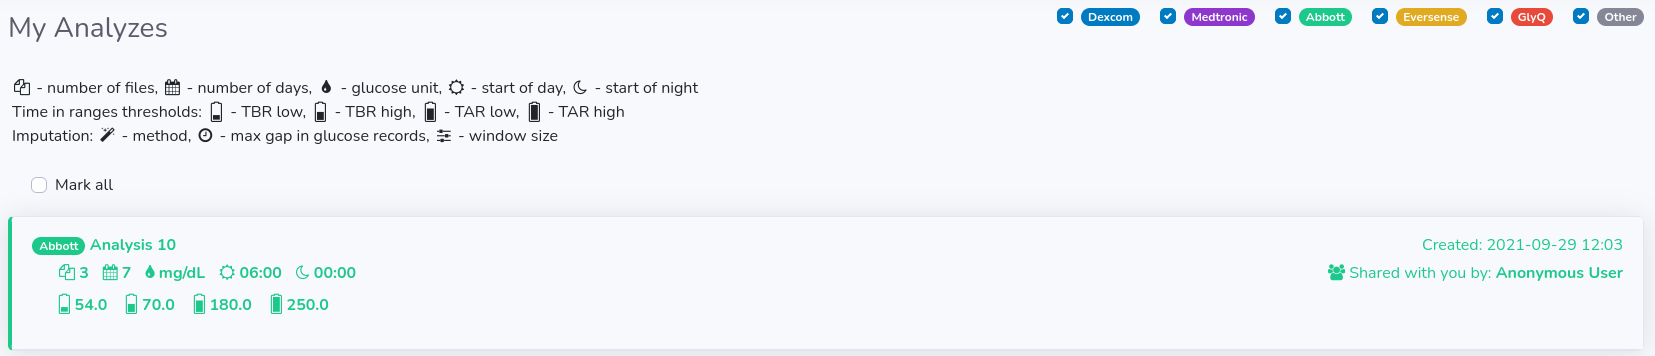
The last panel presents the results of the analysis. The data is presented in three subsections: Analysis Metadata, Glyceamic Indices and Time in range plots.In Analysis Metadata there is some basic information on the analysis itself, so you can see what type of files and how many of them were taken for the analysis, when it was created, how many days were analyzed, what was the glucose unit, what were the time ranges for day and night hours, what values were set for time in range plots and what were the imputation settings (method, max gap, window size).
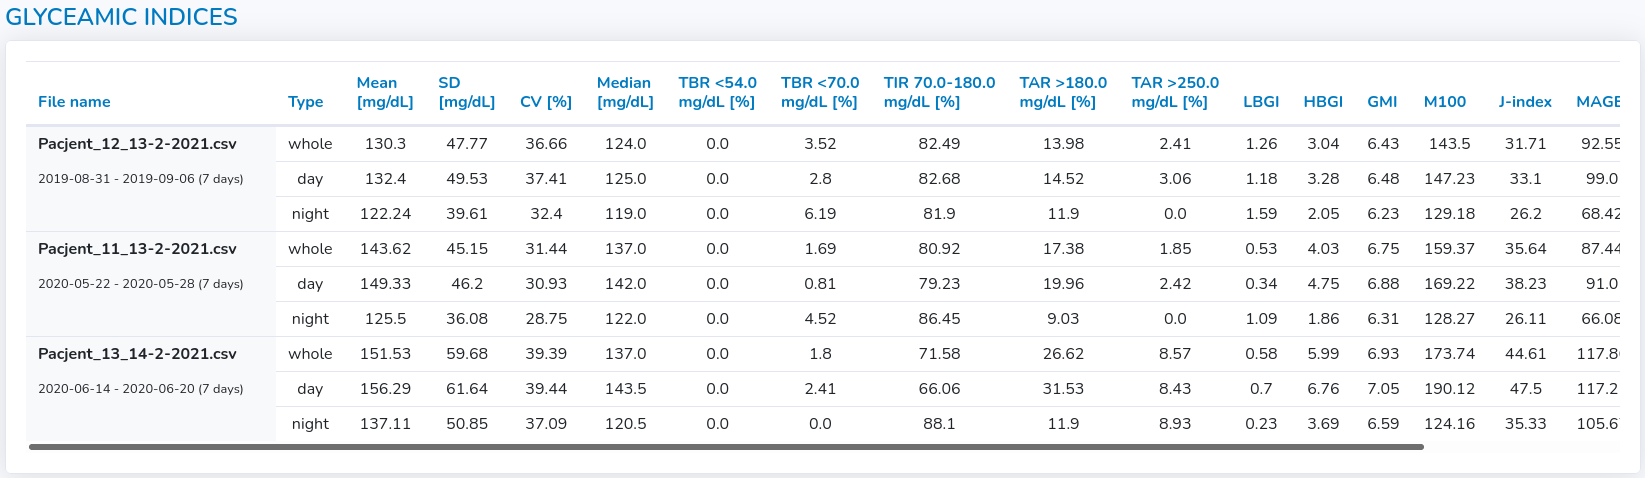
In the main table, the glycemic variability indices are gathered for all files for the whole period and separately for both day and night.
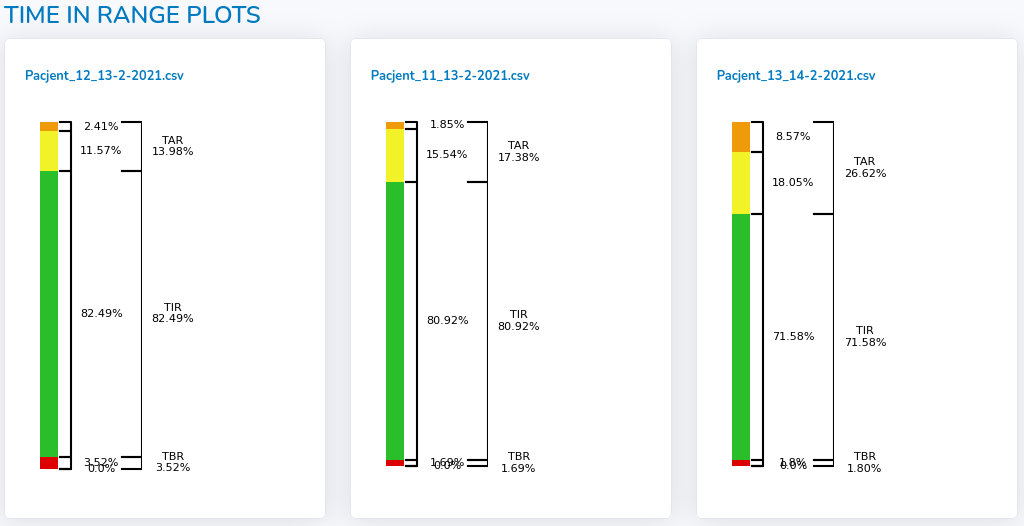
Visual summary as "Time in range" graph for each file is provided in the last section (see figures below).
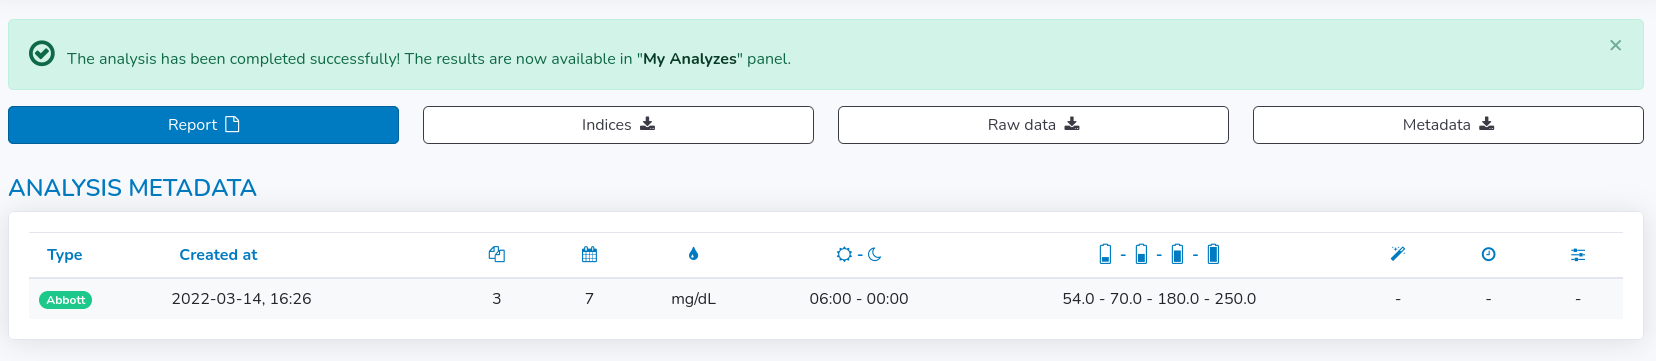
- "Create report" - generates summary .pdf report from the analysis, including analysis' metadata, indices and plots for each day of the analysis separately for each file
- "Indices to CSV" - generates a .csv file only with indices presented in the table
- "Raw data to CSV" - generates a .csv file with raw data (including file name and glucose records together with their corresponding timestamps and type).
- "Analysis metadata to CSV" - generates a .csv file with analysis metadata i.e. number of files taken for the analysis, number of days, glucose unit, day and night hours, time in range thresholds and imputation method with longest gap in glucose records and window size if the imputation was applied.
Type 1 means that the reading was read from the originally uploaded file.
Type 2 means that the reading was imputed by GlyCulator.
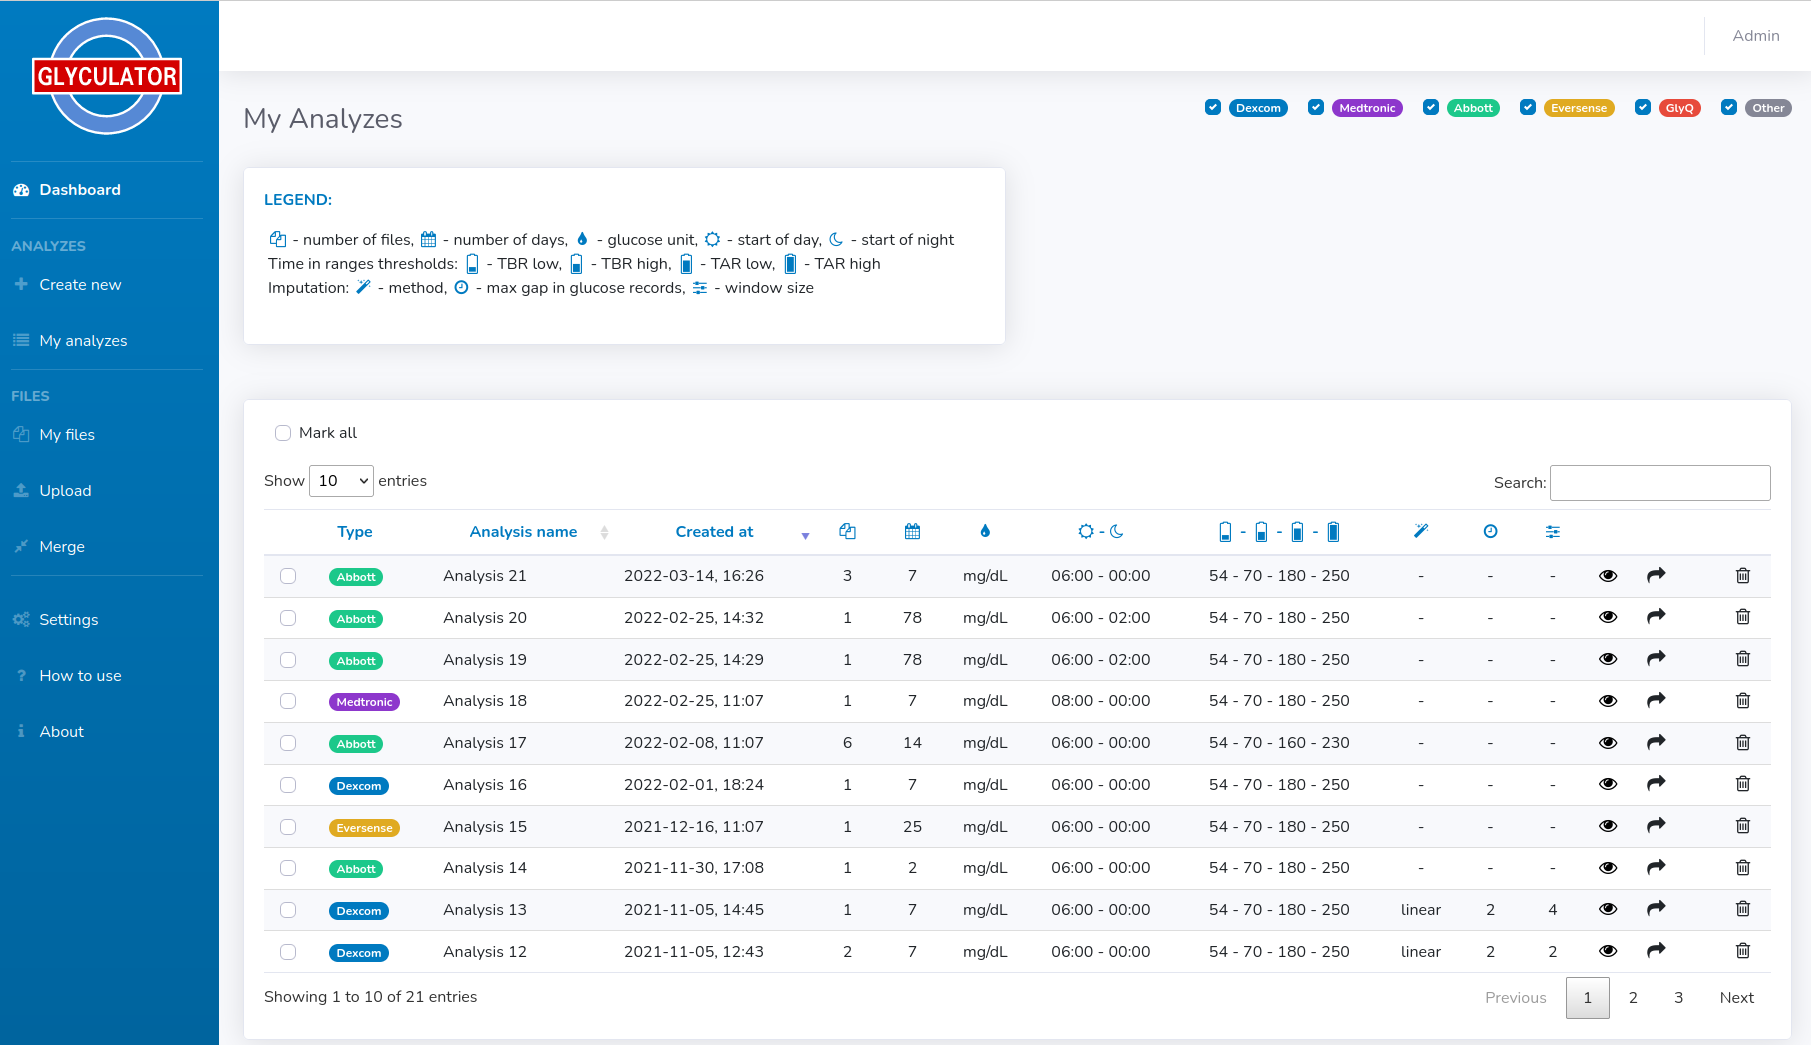
General view
All analyses are gathered in a table. Each analysis is marked with a color and badge corresponding to a particular manufacturer or file format on which the analysis was performed. For this moment, we can distinguish between:- Dexcom
- Medtronic
- Abbot
- Eversense
- GlyQ
- Other
Detailed view
You can see all the information associated with the analysis by clicking on the eye icon for specific analysis (figure below).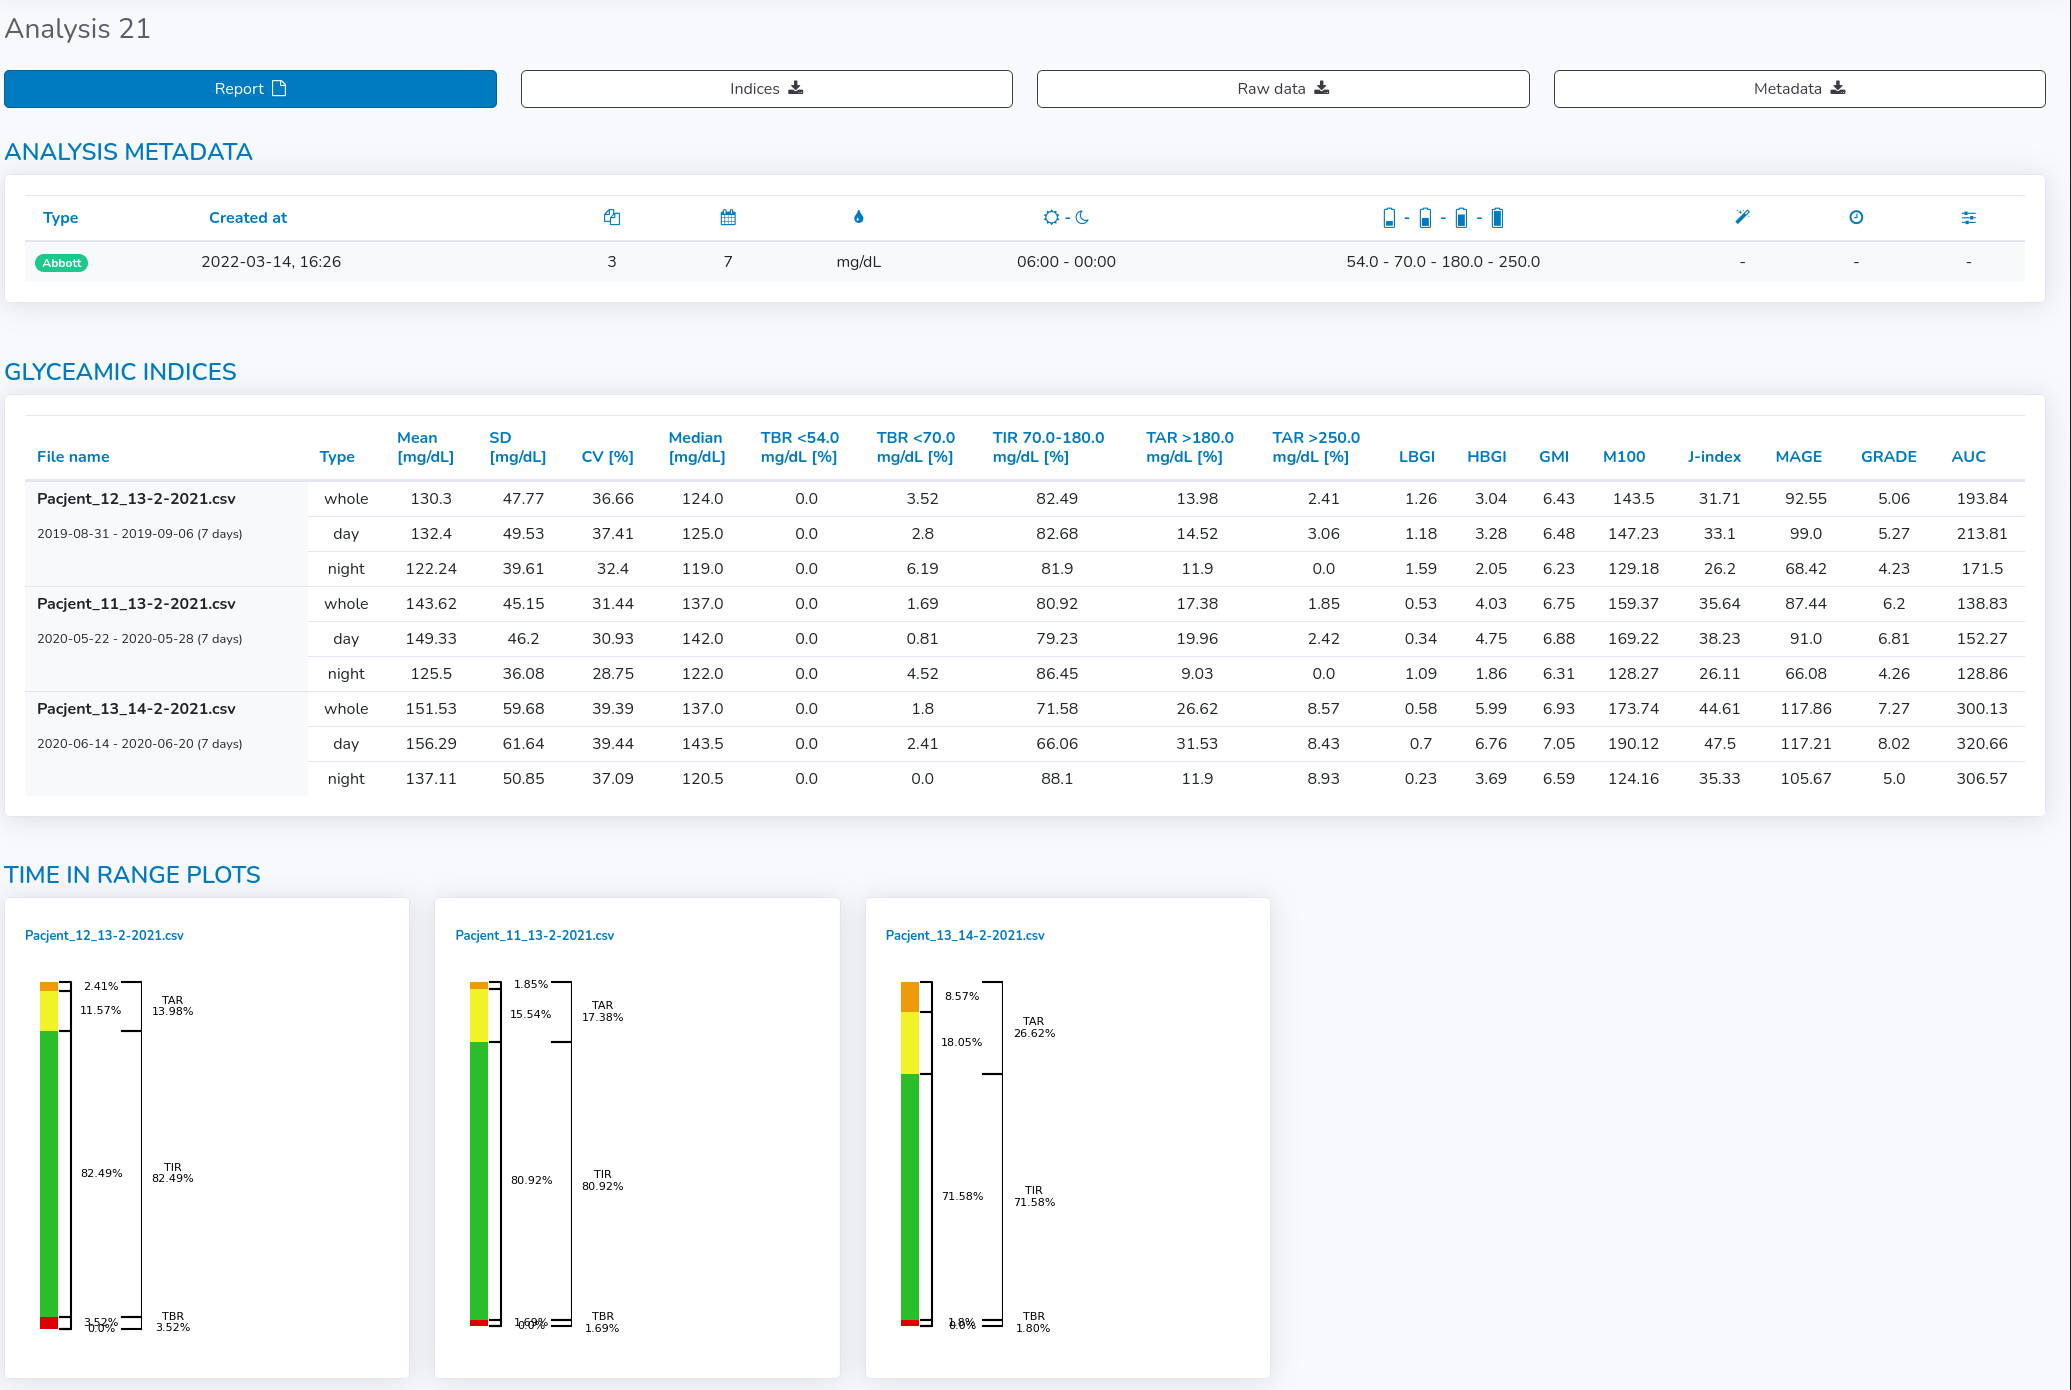
In the main table, the glycemic variability indices are gathered for all files for the whole period and separately for both day and night.
Moreover, a visual summary as "Time in range" graph for each file is provided underneath the Glyceamic Indices table.
At the top of the detailed view, there are four buttons, which enable the user to get the analysis data in different forms:
- "Create report" - generates summary .pdf report from the analysis, including analysis' metadata, indices and plots for each day of the analysis separately for each file
- "Indices to CSV" - generates a .csv file only with indices presented in the table
- "Raw data to CSV" - generates a .csv file with raw data (including file name and glucose records together with their corresponding timestamps and type).
- "Analysis metadata to CSV" - generates a .csv file with analysis metadata i.e. number of files taken for the analysis, number of days, glucose unit, day and night hours, time in range thresholds and imputation method with longest gap in glucose records and window size if the imputation was applied.
Type 1 means that the reading was read from the originally uploaded file.
Type 2 means that the reading was imputed by GlyCulator.
Managing analyses and sharing
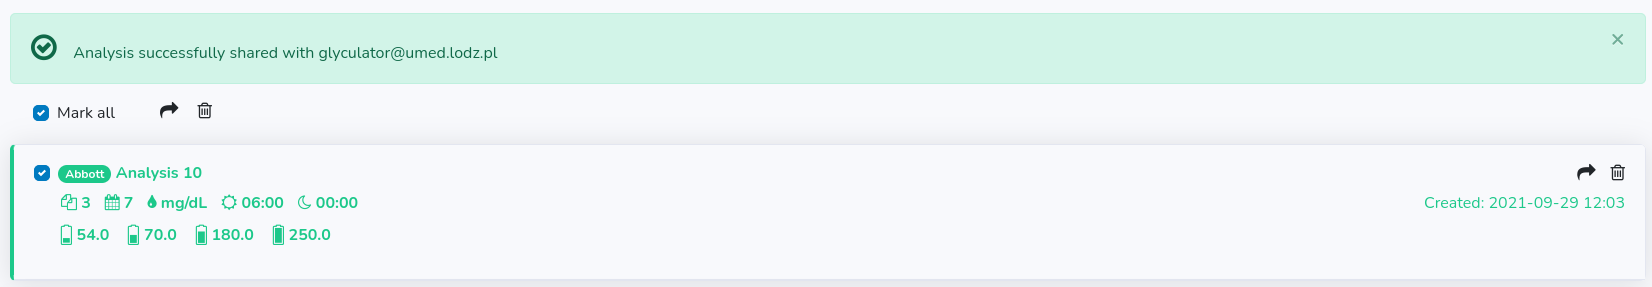
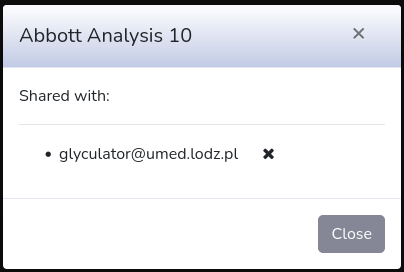
Each file can be shared with other users of GlyCulator or deleted from your analyses repository. These actions can be taken manually for each single file (next to creation date) or can be taken for multiple analyses at the same time. In order to share or delete multiple analyses you have to mark more than one checkbox (on the left side of the analysis name) or mark them all ("Mark all" at the top). Then all group actions will appear next to "Mark all" checkbox: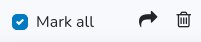
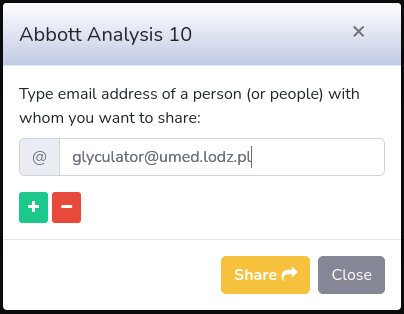
Once you type all email addresses, click on "Share" button. Whether the sharing is successful or not, the appropriate message will show up.

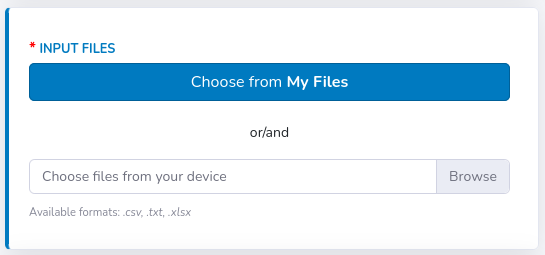
In order to be able to choose files from "Choose from My files" option while creating a new analysis, first you have to upload the desired files to GlyCulator in one of two ways:
- either by creating a new analysis, where you have to browse files from your computer
- or by uploading files directly in "Upload" module, apart from any analysis
It does not matter whether you do it with the first method or the second, however, the latter option enables you to do some things in advance.
Here, you can upload files from multiple manufacturers separately, and then e.g. convert all of them to GlyQ format once they appear in "My files".
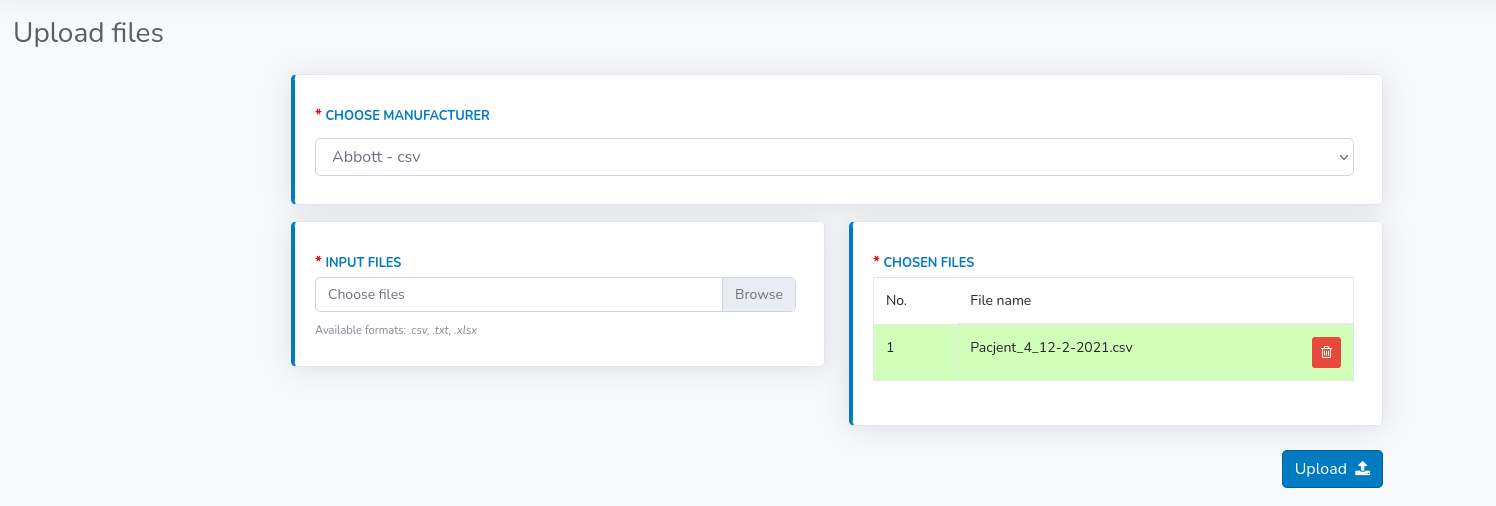
Basically, the "Upload" panel resembles "Create new", but is much simplified. Here you only have to choose the manufacturer from the available list and then browse files from your computer.
The list of chosen files will be displayed as a table, where you will be able to modify your choice if needed (remove files if added by mistake). You can browse files multiple times from different directories and they will be accumulating in the table.
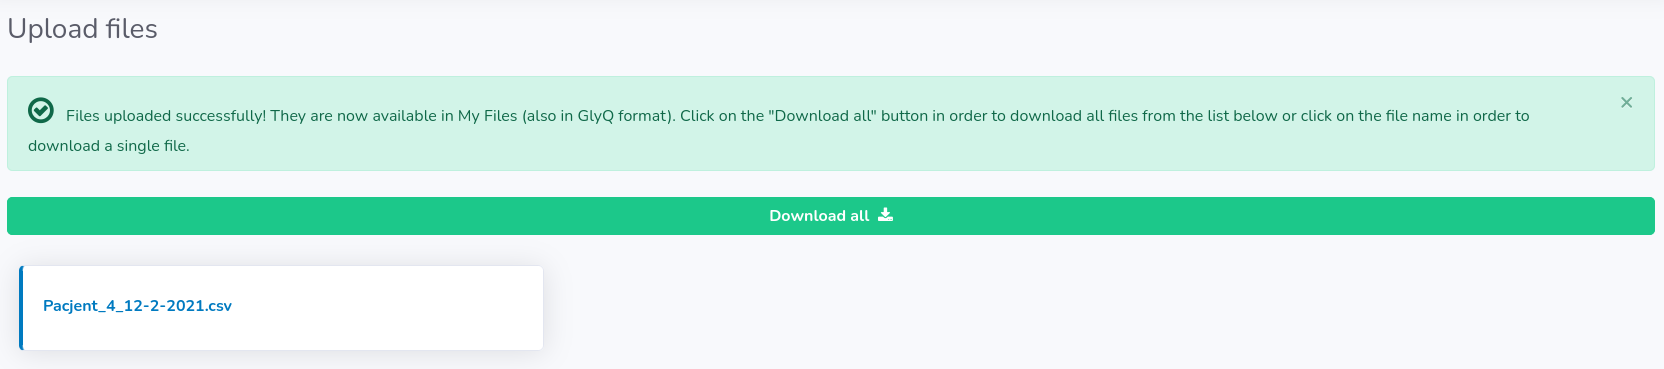
If all desired files are visible in the table click "Upload" button.
You will be informed when the uploading is finished and then you will be able to download the files in GlyQ format if needed (either separately or all at once by clicking "Download all" button). Remember, that we do not store your original files on the server and hence the only way you can retrieve data from a particular file is the GlyQ file.
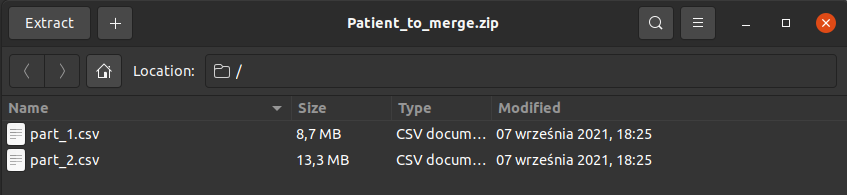
If you deal with a patient that provides you with multiple files, usually containing overlapping dates and records, then "Merge" module comes as a solution.
It looks exactly like "Upload" module, however here you have to upload patient's files in a compressed format e.g. .zip, .tar. So, if you have e.g. 2 files for one patient then you have to manually compress them on your device and choose compressed file as "Input files". In the example visible in the image below on the right-hand side, you can see that there are two .csv files for one patient ("part_1.csv" and "part_2.csv") compressed to one .zip file ("Patient_to_merge.zip").
You can upload multiple compressed files in one merge, provided that they all come from the same manufacturer which you chose at the beginning.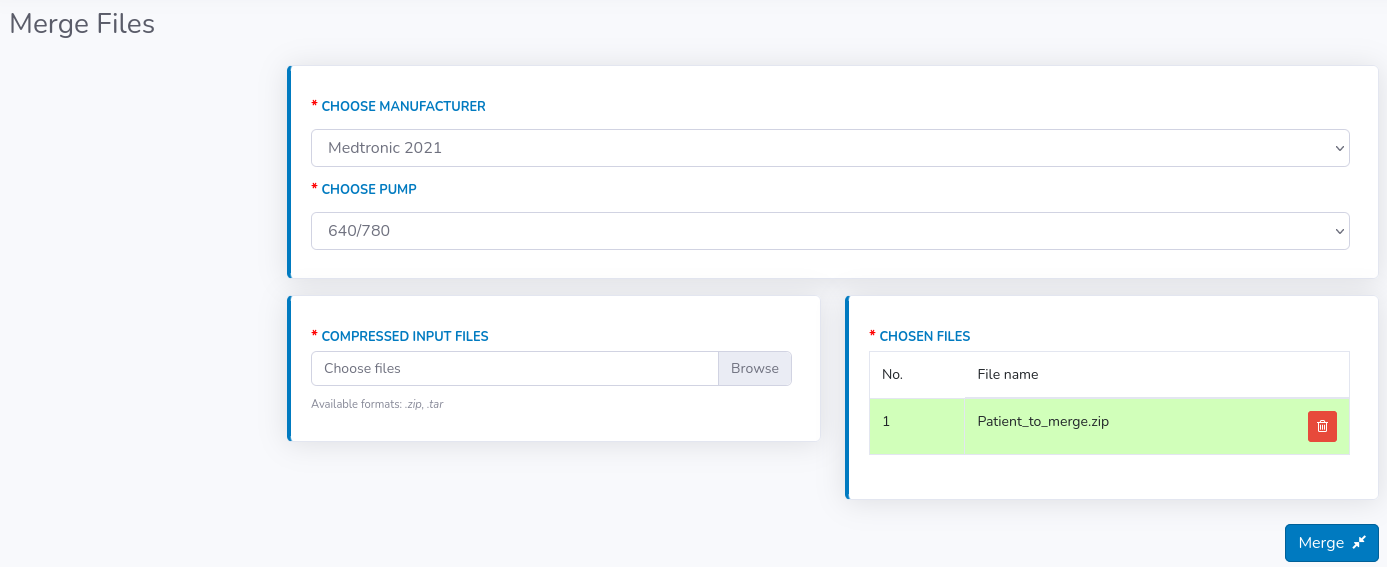
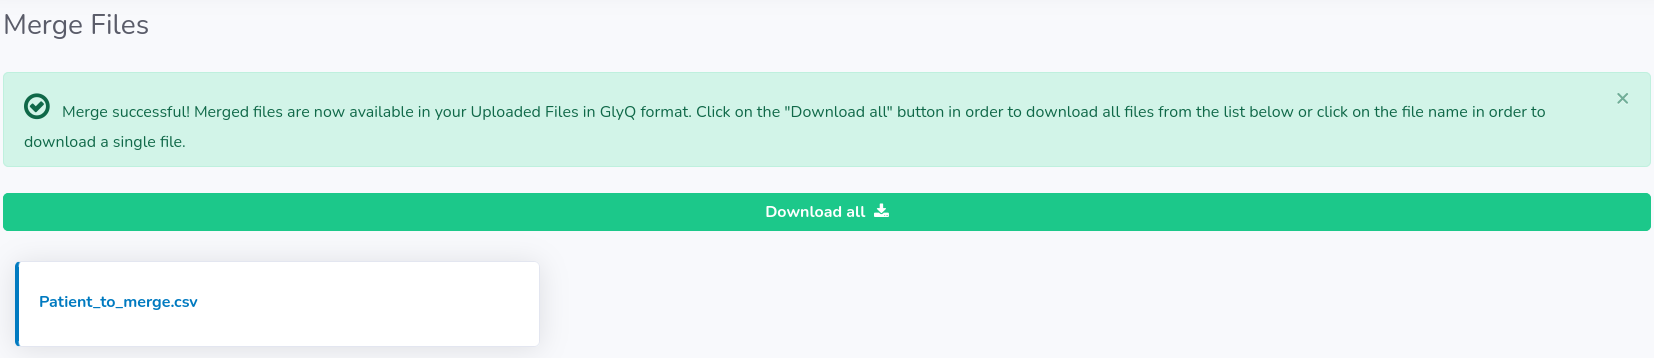
You will be informed when merging is finished. As a result of a merge, at the end you will obtain a single file for each compressed file with a possibility to download it on your device in GlyQ format (either separately or all at once by clicking "Download all" button). Remember, that we do not store your original files on the server and hence the only way you can retrieve data from a particular file is the GlyQ file.
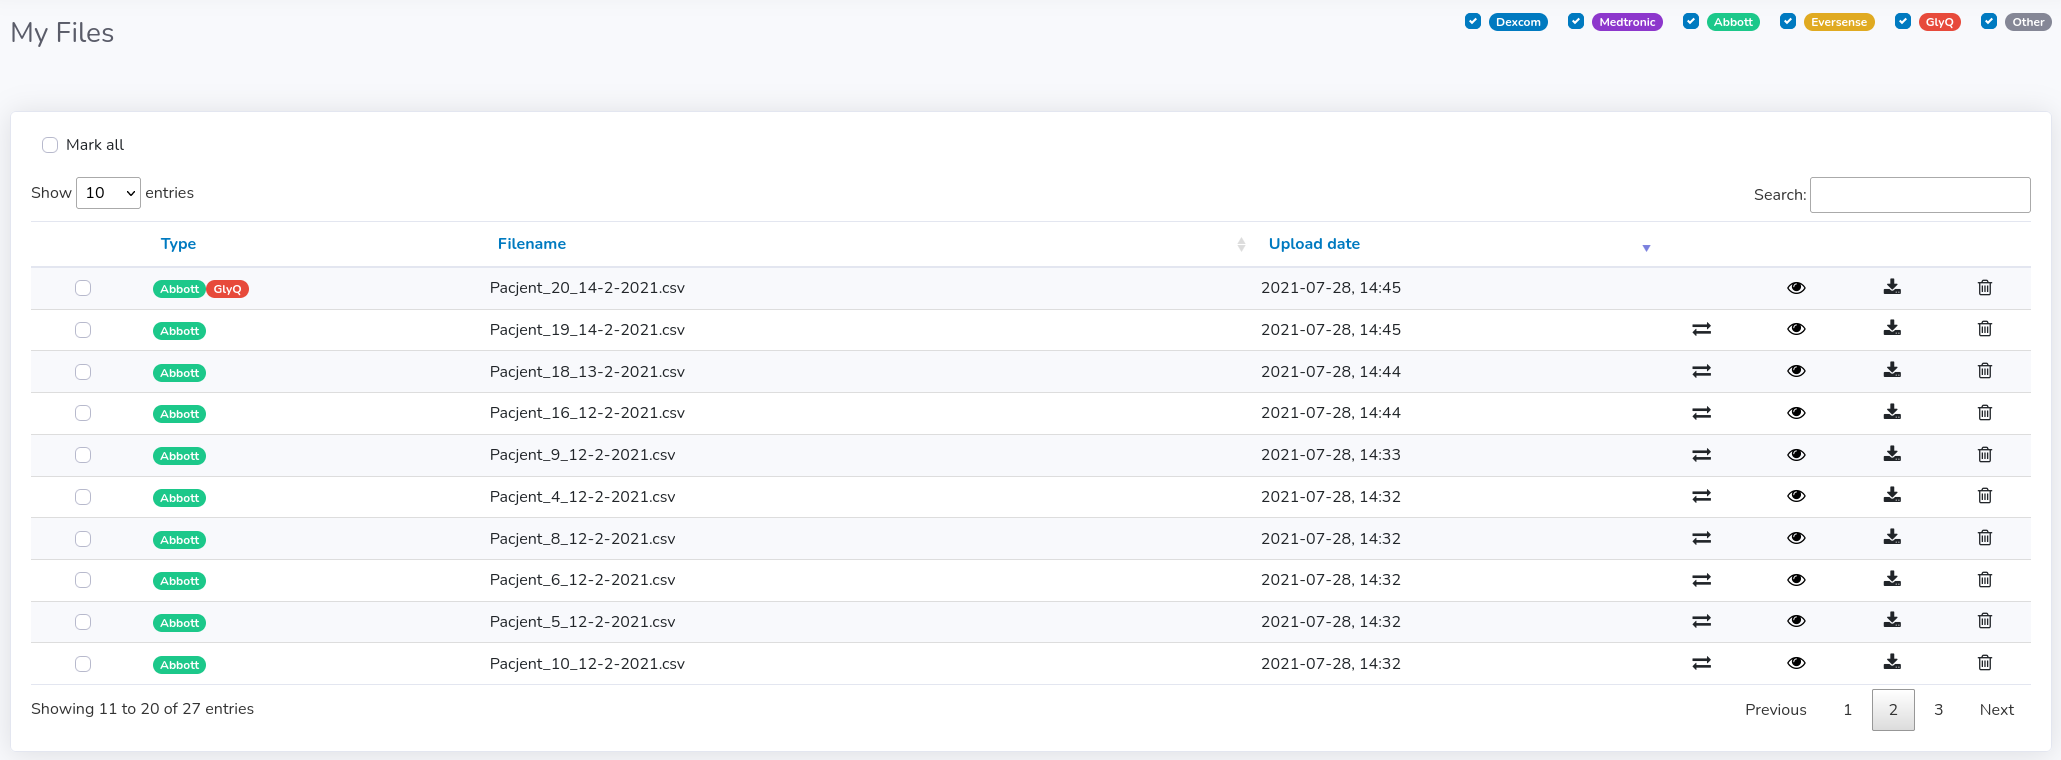
General view
Each file is marked with a color and badge corresponding to a particular manufacturer or file format. For this moment, we can distinguish between:- Dexcom
- Medtronic
- Abbot
- Eversense
- GlyQ
- Other
Detailed view
You can see some basic statistics concerning each file by clicking on the eye icon in the corresponding table row (see figure below).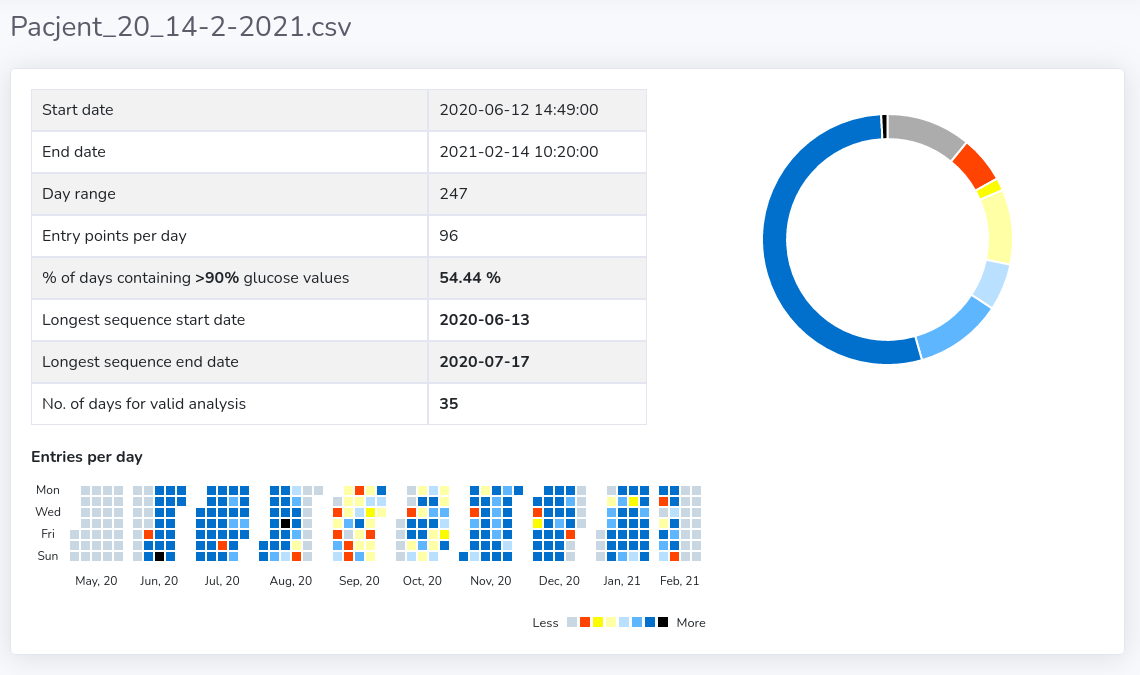
- "Start/End date" within the file with valid glucose records.
- "% days containing 90% glucose values" - how many days had more than given daily 90% of available measurements data (predefined at 90% of available valid measurements, not missing) - presented in details in "Entries per day" at the bottom and "Donut Chart" on the right
- "Longest sequence start/end date" – the start and end dates for the determined longest consecutive sequence of days with more than daily 90% of valid records
Managing files
Each file can be converted to GlyQ format, downloaded as GlyQ or deleted from your files. These actions can be taken manually for each single file (next to upload date) or can be taken for multiple files at the same time. In order to convert, download or delete multiple files you have to mark more than one checkbox (on the left side of the filename) or mark them all ("Mark all" at the top). Then all group actions will appear next to "Mark all" checkbox: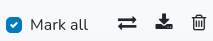
Genesis
GlyQ is a file format that was introduced by GlyCulator Team for the purpose of unification of various file formats that come from glucose measuring devices as input files for analysis. Each manufacturer (Abbott, Senseonic, Dexcom, Medtronic etc.) provides CGM files with different data structure and hence in order to be able to analyze files automatically we had to apply different algorithms for reading different file types and structures.Moreover, in order to save the data from the files so that it was possible to reuse it in future analyses and to be able to go back to the analyses that were already created, we had to eliminate the issue with sensitive data that could be included inside files.
Thus, we decided that no original file will be stored on our server and they will be removed immediately after the file upload. The most valuable information regardless of the manufacturer, device and data structure was in fact: glucose records with corresponding timestamps associated with given filename. For that reason this is the only thing that we keep in our database, excluding the association with a real patient.
As a result, when the user wishes to download already uploaded file ("Download file" action in "My files") it will be only available in GlyQ format. You will not be able to retrieve the original file!
Original GlyQ files vs. converted to GlyQ
There are two types of GlyQ files:- original
- converted to GlyQ from other file format
Due to the fact that we do not store original files on our server, as it was mentioned before, we assume that you want to save a single file after merging, not all files before merging. Hence, it is saved directly as GlyQ file.
Once you upload your file in accordance with its data structure (while choosing manufacturer) it will appear in "My files" and you will be able to convert it to GlyQ. If you decide to convert your original files to GlyQ you will see in "My files" that such files will gain a red GlyQ badge, although preserving the original manufacturer badge as well:

Why is GlyQ useful?
Conversion to GlyQ format enables you creating analyses for all patients you want to have included in, regardless of the manufacturer of their glucose measuring devices (under condition that they have the same number of glucose measurements per day).While creating a new analysis you have to choose "GlyQ96" or "GyQ288" from the "Manufacturer" list. Then, when you click on "Choose from My Files" all files converted to GlyQ or originally GlyQ will appear giving you huge analytical possibilities.
The recommended approach for benchmarking studies is to use the graphical interface of the GlyCulator 3.0 web platform. However, due to limitations of multi-file processing, we suggest that users with slow internet access or benchmarks exceeding 500 patients inquire about access to the application programming interface (API). To be granted programmatic access to the GlyCulator 3.0, you must be registered as a user and contact us for the Special services clause, described in detail in the About section (https://glyculator.btm.umed.pl/about). After the initial verification, you will be granted programmatic access to GlyCulator 3.0. Detailed documentation on GlyCulator 3.0 API is provided at https://glyculator.btm.umed.pl/api/docs. Due to GlyCulator 3.0 being a continuously updated and developed tool, some API functions may not be functional at all times. All the API functions required for benchmarks will be conserved to guarantee the reproducibility of GlyCulator 3.0 benchmarking studies.
The first step is the file upload. It can be performed by directly uploading files on the GlyCulator 3.0 web platform. For more information, see the “UPLOAD FILES” section of the user manual (https://glyculator.btm.umed.pl/user_manual). An alternative approach is using /upload function via API – remember that you need to pass a binary file stream into the POST request. To use predefined file standards, define device_type arguments – 1 for Dexcom, 3/5 for Abbott (.csv/.txt), 4 for Eversense, 8 for Medtronic, 9 for GlyQ96, 10 for GlyQ288 and 99 for user-defined. For date_format, available options are - 0 for MM/DD/YYYY (+hh:mm:ss), 1 for DD/MM/YYYY (+hh:mm:ss), 2 for YYYY/MM/DD (+hh:mm:ss).
After all the files are successfully uploaded, we recommend using the internal GlyQ standard. The GlyQ allows for the integration of files from different sensor systems, as long as they provide the same sampling frequency (currently supported only 288 and 96/day). For more details on the GlyQ standard, see the “WHAT IS GLYQ?” section of the user manual. The conversion can be done by using the conversion option in the “My files” tab, as described in the “MY FILES” section of the user manual. The conversion can also be performed using the /convert_file_by_hash API function, with hash available with the /files query.
After the files are uploaded and converted to GlyQ, a list of files for further analysis should be created. File selection can be performed either manually (by selecting appropriate file names via GUI interface) or using the /files query via API. Moreover, basic statistics for each uploaded file can be assessed either manually with the file’s detailed view within the “My files” tab (described in detail in the “MY FILES” section of the user manual) or by using API /files/{file_hash} query. We suggest using basic statistics to reduce the number of files included in the benchmark that could not be processed due to the lack of data in the predefined analysis period. For example, in the single-center benchmark example, the maximum number of files processed in a single period was 343 for the isCGM in 2021, which is ~7.5% of all available CGM files (4560). If all files were included at the filtration step, this would result in a 9-minute processing lag instead of the required 40 seconds.
The next step, creating a new analysis, is described in detail in the “CREATE NEW ANALYSIS” section of the user manual. For most benchmarking studies, we recommend using the predefined start and end dates to eliminate any potential sources of bias resulting from seasonal and holiday effects. As to CGM data selection based on dates and not active time criteria, it is crucial to assess % active-time for each processed file. Analysis creation can also be performed using API, with the /analyses/new function, which avoids automated quality assessment. The /analyses/new function requires date_from and date_to to be parsed for each file_hash included in the benchmark. The programmatic quality assessment is based on evaluating the “basic statistics” for each file, as described above. For the configuration of the imputation method in the /analyses/new, the imputation_method may be set as linear (for linear imputation), mean (for mean value imputation) or left empty to turn it off. After the analysis is created, the GlyCulator 3.0 will run the computation of glycemic variability indices in the background. Most standard benchmarks should execute in under 1 minute, and for the larger ones (500 files/run), the computation should take around 100-115 seconds.
The computed analysis can be accessed via the GlyCulator “My analyses” tab, as described in the “MY ANALYSES” section of the user manual. It can also be accessed programmatically using /analyses/{session_id} request. The execution time for the analysis is only accessible via the API. Downstream analysis of benchmark results should be performed using the “Indices” .csv files or the “indices” dictionary available using the above-mentioned API query. We recommend not removing once completed benchmark runs from the GlyCulator 3.0 to avoid re-running the computation multiple times. Multiple executions of the same list of files on a predefined period will result in the same glycemic variability indices, as all the glycemic variability calculation algorithms are defined as mathematical functions and do not use pseudorandom states. The results from the benchmark runs will be available under the user profile in GlyCulator 3.0 unless explicitly removed by the user. Sharing the analyses will not result in any modification of the original analysis.
For more details or questions regarding implementation with API, you can request access to the code used for the sample benchmarking study via e-mail to biostat@umed.lodz.pl. All files required for the reproducing of the analysis are available at https://glyculator.btm.umed.pl/user_manual in the User manual section.
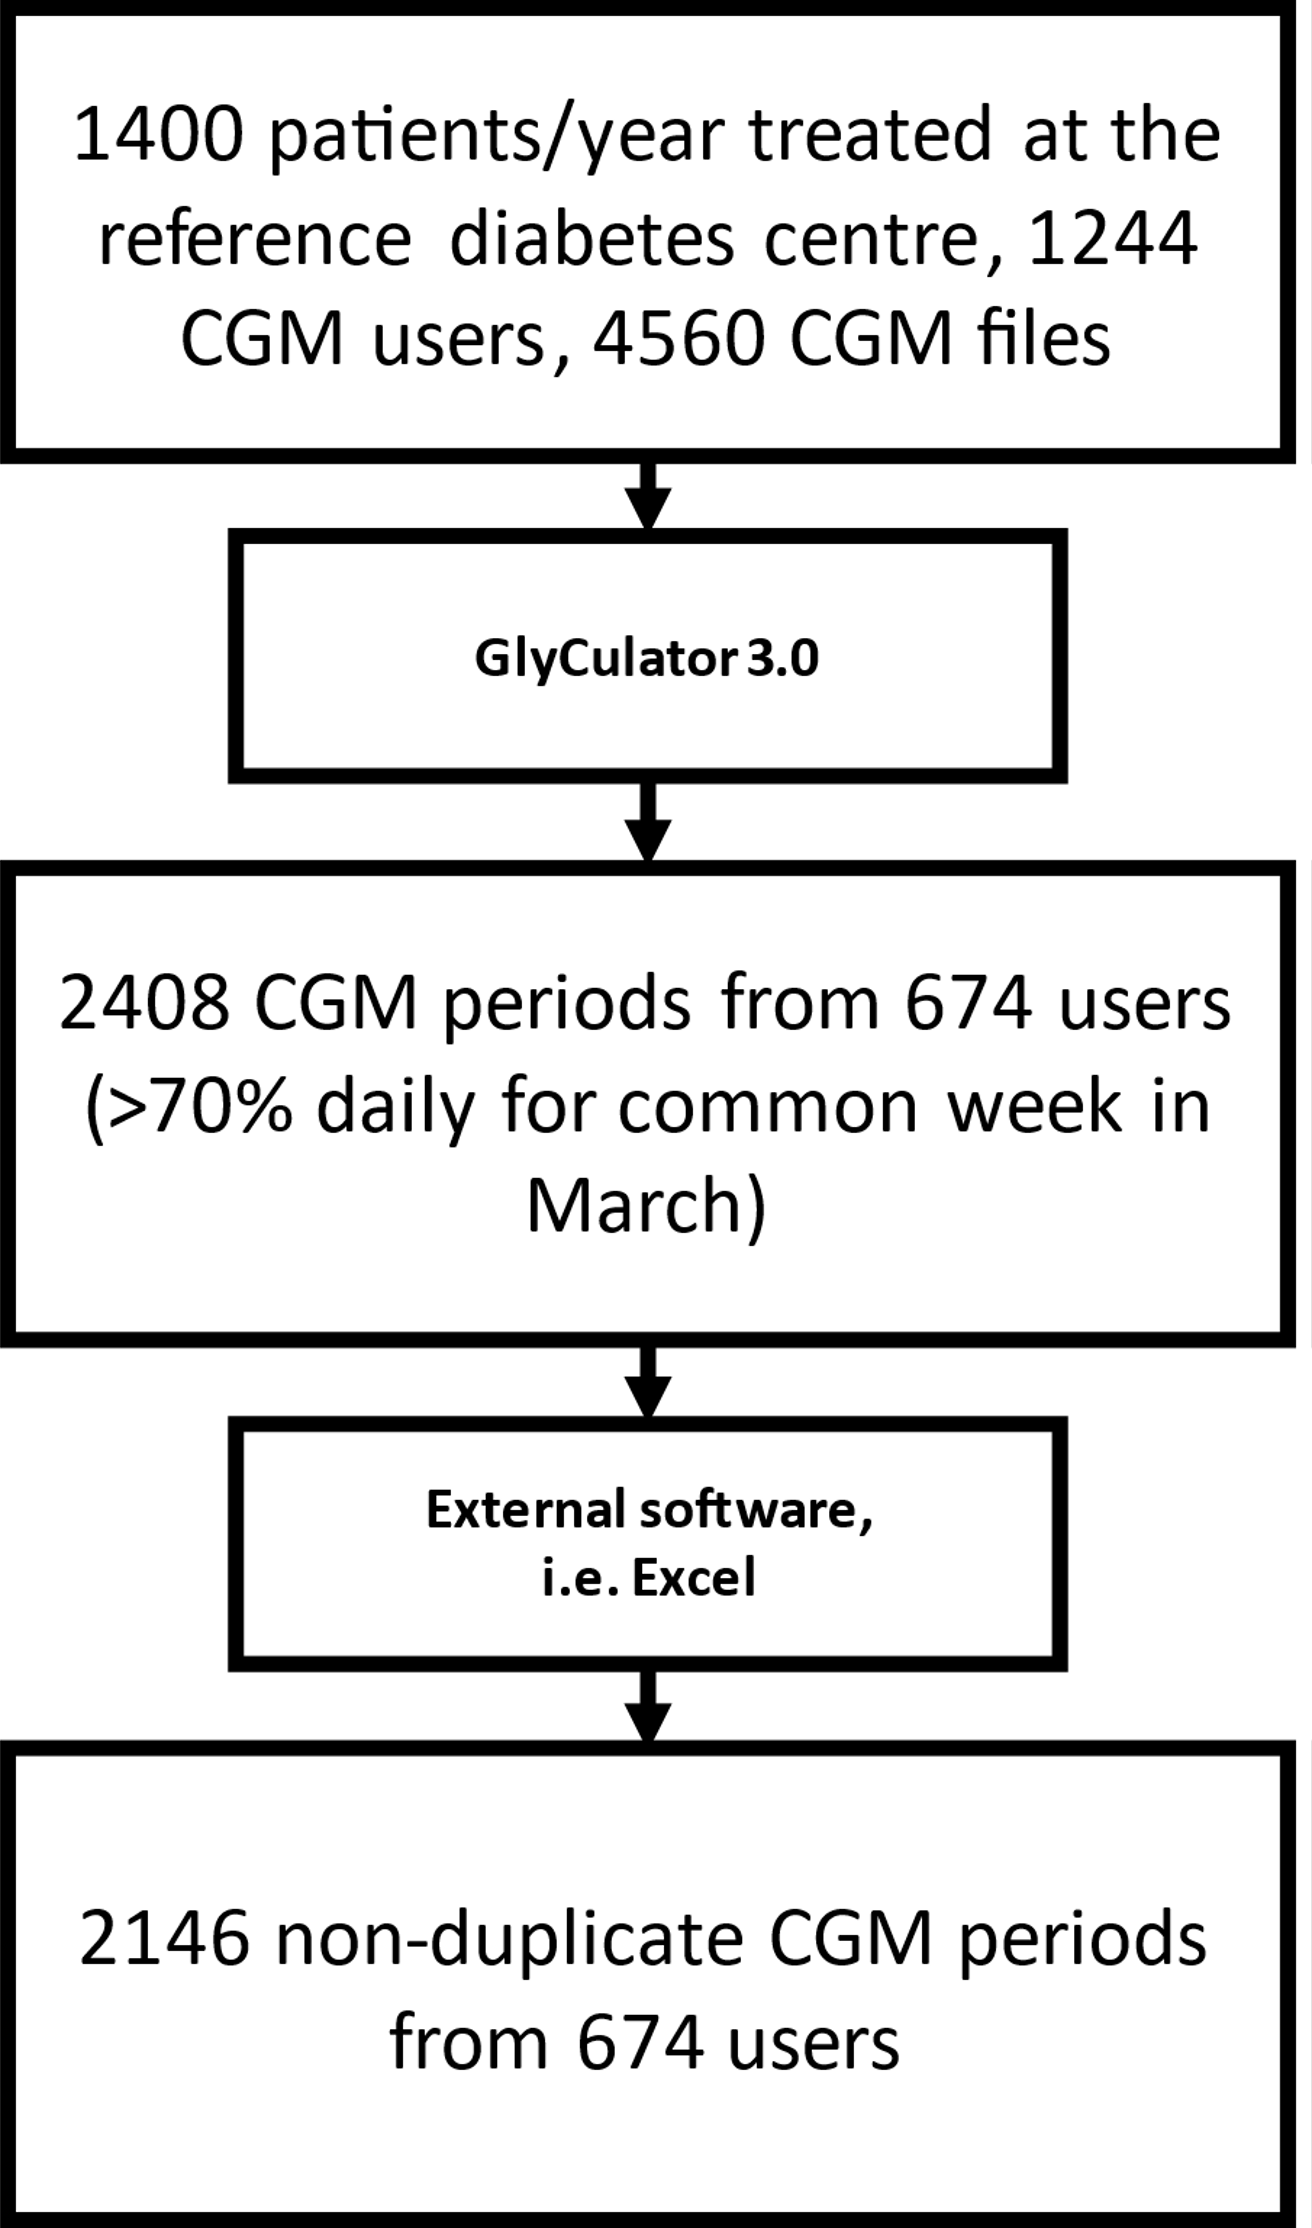
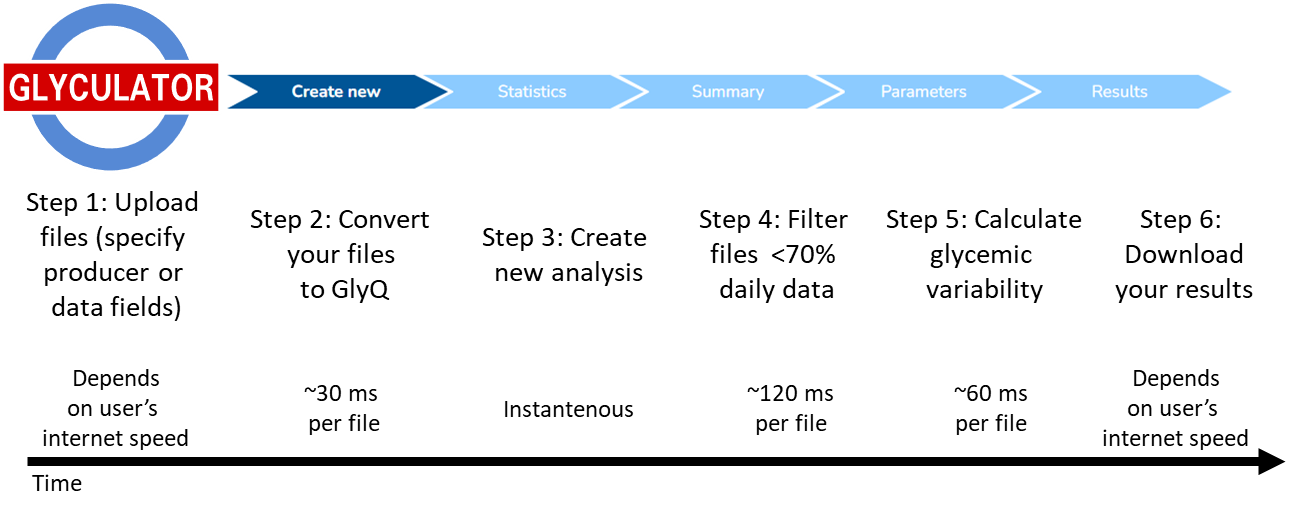
GlyCulator 3.0 is intended to provide an easy way to quickly integrate, parse and analyze large amounts of CGM data. As a demonstration of the tool’s capabilities we performed a single-center real-life data CGM benchmark. Data was collected from our regional pediatric diabetes care reference center, which treats more than 1400 patients with type 1 diabetes annually (children and adults up to 26 years of age), with data available from 1244 CGMs users. Our goal was to determine what percentage of CGM users satisfied Time in Range (TIR) consensus criteria from 2017 to 2021. Similar to our previous study, we predefined source data for two-week periods from March. We decided to investigate data from March to avoid confounding by any international or national holidays and to avoid any possible influence from seasonal effects. We manually downloaded data from all registered patients in the manufacturer’s software - 4560 CGM files which covered over 900 thousand patient-days. The initial quality assessment was performed with GlyCulator 3.0, once for all 4560 CGM files, and only the files covering the predefined periods were included for the further glycemic variability analysis. This minimized number of redundant data processed at each quality assessment step, improving speed for all subsequent analyses. Next, each set of files (with available data, separate for 288/day and 96/day sampling) was provided for GlyCulator 3.0 to create the new analysis, in ten respective runs. Altogether, 2408 periods from 674 patients were passed for calculation of glycemic variability metrics (Figure 1).
The calculation for the whole group took 380 seconds with average times per analysis step listed in Figure 2.
After the CGM files were trimmed to the chosen dates, inspected for record quality (≥70% CGM active-time) and processed with GlyCulator 3.0, we performed manual analysis of glycemic variability using Excel. First, we removed any duplicate records, defined as originating from the same patient CGM, and covering the same period. Resulting in 2146 periods of CGM data from 674 patients eligible for analysis. We used those to visualize time-in-range from 2017 to 2021 using Python and matplotlib (Figure 3).
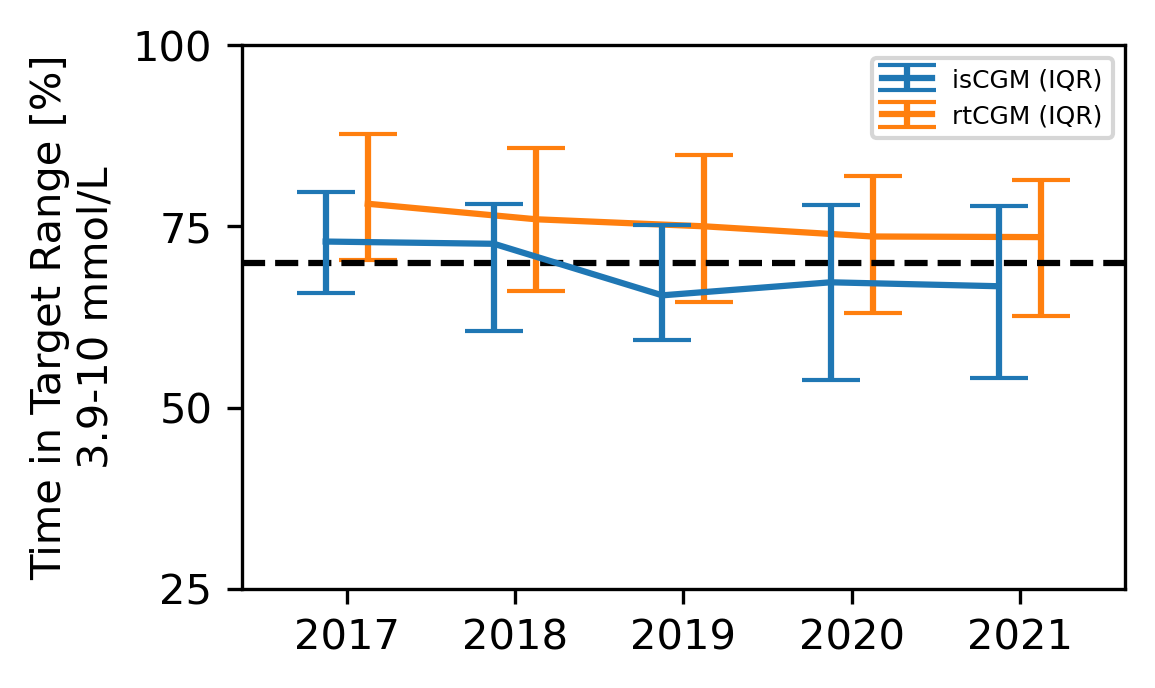
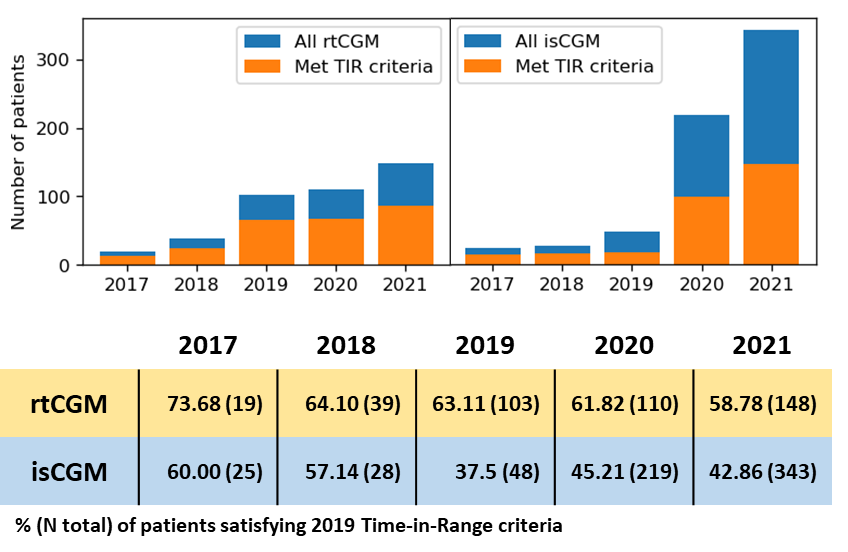
Overall, we observed that ~60% of rt-CGM consistently met TIR>70% target, while is-CGM patients’ success rate dropped from ~60 to 40% in 2019 but slowly improved to ~45% in 2020 and 2021 (Figure 4).
We did not directly compare the patients’ outcomes between the two technologies due to the expected presence of multiple confounding factors and differences between rtCGM and isCGM-derived glycemic variability metrics (Michalak et al. Pediatric Diabetes 2019; 10.1111/pedi.12854).
Such results should be interpreted in light of local practice (CGM reimbursement, patient education) and changes in technology. Still, this analysis provided an important insight into the quality of care in the benchmarked center and may help identify areas that need improvement.
Importantly, performing a similar assessment could be done manually by inspecting each patient in the manufacturer’s software or running the raw files through other available software – but such an approach would be much more time-consuming and prone to human error.
All the files used in the analysis were anonymized and were made available on the website, along with a detailed manual to recreate our example analysis. As an additional benefit, we provided a considerable amount of available, real-life CGM data from children and young adults with T1D for reference of independent research.